 |
| AP Board Class 8 Maths Chapter 7 Frequency Distribution Tables and Graphs InText Questions Textbook Solutions PDF: Download Andhra Pradesh Board STD 8th Maths Chapter 7 Frequency Distribution Tables and Graphs InText Questions Book Answers |
Andhra Pradesh Board Class 8th Maths Chapter 7 Frequency Distribution Tables and Graphs InText Questions Textbooks Solutions PDF
Andhra Pradesh State Board STD 8th Maths Chapter 7 Frequency Distribution Tables and Graphs InText Questions Books Solutions with Answers are prepared and published by the Andhra Pradesh Board Publishers. It is an autonomous organization to advise and assist qualitative improvements in school education. If you are in search of AP Board Class 8th Maths Chapter 7 Frequency Distribution Tables and Graphs InText Questions Books Answers Solutions, then you are in the right place. Here is a complete hub of Andhra Pradesh State Board Class 8th Maths Chapter 7 Frequency Distribution Tables and Graphs InText Questions solutions that are available here for free PDF downloads to help students for their adequate preparation. You can find all the subjects of Andhra Pradesh Board STD 8th Maths Chapter 7 Frequency Distribution Tables and Graphs InText Questions Textbooks. These Andhra Pradesh State Board Class 8th Maths Chapter 7 Frequency Distribution Tables and Graphs InText Questions Textbooks Solutions English PDF will be helpful for effective education, and a maximum number of questions in exams are chosen from Andhra Pradesh Board.Andhra Pradesh State Board Class 8th Maths Chapter 7 Frequency Distribution Tables and Graphs InText Questions Books Solutions
| Board | AP Board |
| Materials | Textbook Solutions/Guide |
| Format | DOC/PDF |
| Class | 8th |
| Subject | Maths |
| Chapters | Maths Chapter 7 Frequency Distribution Tables and Graphs InText Questions |
| Provider | Hsslive |
How to download Andhra Pradesh Board Class 8th Maths Chapter 7 Frequency Distribution Tables and Graphs InText Questions Textbook Solutions Answers PDF Online?
- Visit our website - Hsslive
- Click on the Andhra Pradesh Board Class 8th Maths Chapter 7 Frequency Distribution Tables and Graphs InText Questions Answers.
- Look for your Andhra Pradesh Board STD 8th Maths Chapter 7 Frequency Distribution Tables and Graphs InText Questions Textbooks PDF.
- Now download or read the Andhra Pradesh Board Class 8th Maths Chapter 7 Frequency Distribution Tables and Graphs InText Questions Textbook Solutions for PDF Free.
AP Board Class 8th Maths Chapter 7 Frequency Distribution Tables and Graphs InText Questions Textbooks Solutions with Answer PDF Download
Find below the list of all AP Board Class 8th Maths Chapter 7 Frequency Distribution Tables and Graphs InText Questions Textbook Solutions for PDF’s for you to download and prepare for the upcoming exams:8th Class Maths 7th Lesson Frequency Distribution Tables and Graphs InText Questions and Answers
Do this
Question 1.
Here are the heights of some of Indian cricketers. Find the median height of the team. [Page No. 154]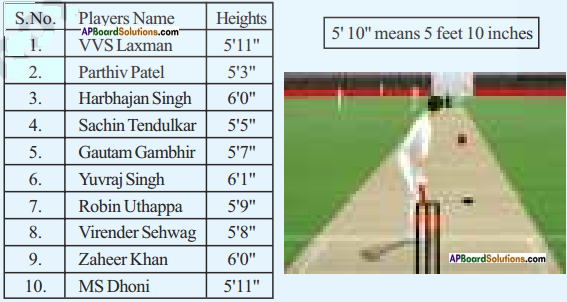
Answer:
The ascending order of heights is 5’3″, 5’5″, 57″, 5’8″, 5’9″, 571″, 571″, 6’0″, 6’0″, 6’7″
Number of players = 10 (is an even)
Median = Mean of (n2) and (𝑛2+1) terms = Mean of (102) and (102+1) terms = Mean of 5, 6 terms = 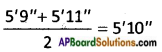
Question 2.
Ages of 90 people in an apartment are given in the adjacent grouped frequency distribution.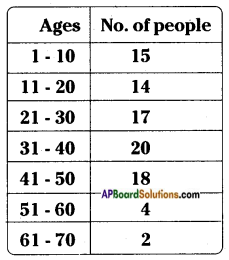
i) How many Class Intervals are there in the table?
ii) How many people are there in the Class Interval 21 – 30?
iii) Which age group people are more in that apartment?
iv) Can we say that both people the last age group (61-70) are of 61, 70 or any other age? [Page No. 158]
Answer:
i) 7 ii) 17 iii) 31 – 40 iv) Yes, they are 62, 63, ……, 69
Question 3.
Long jump made by 30 students of a class are tabulated as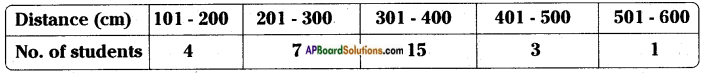
I. Are the given class intervals inclusive or exclusive?
II. How many students are in second class interval?
III. How many students jumped a distance of 3.01 m or more?
IV. To which class interval does the student who jumped a distance of 4.005 m belongs? [Page No. 160]
Answer:
I. Inclusive
II. 7
III. 15 + 3 + 1 = 19
IV. 401 – 500
Question 4.
Calculate the boundaries of the class intervals in the above table. [Page No. 160]
Answer:
Boundaries:
100.5 – 200.5
2005 – 300.5
300.5 – 400.5
400.5 – 500.5
500.5 – 600.5
Question 5.
What is the length of each class interval in the above table? [Page No. 160]
Answer:
100
Question 6.
Construct the frequency polygons of the following frequency distributions. [Page No. 174]
i) Runs scored by students of a class in a cricket friendly match.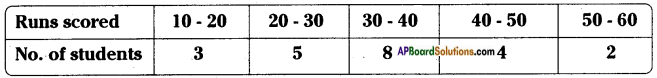
ii) Sale of tickets for drama in an auditorium.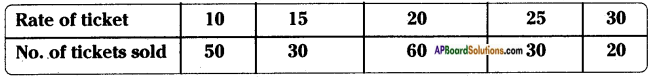
Answer:
i)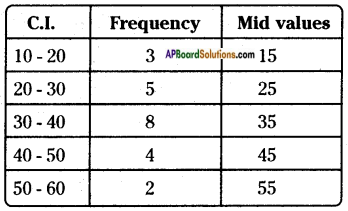
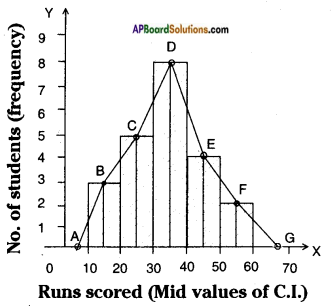
Steps of construction: Runs scored (Mid values of C.I.)
Step – 1: Calculate the mid points of every class interval given in the data.
Step – 2: Draw a histogram for this data and mark the mid points of the tops of the rectangles, (like B, C, D, E, F respectively).
Step – 3: Join the mid points successively.
Step – 4: Assume a class interval before the first class and another after the last class. Also calculate their mid values (A and G) and mark on the axis. (Here, the first class is 10 – 20. So, to find the class preceding 10 – 20, we extend the horizontal axis in the negative direction and find the mid point of the imaginary class interval 60 – 70.
Step – 5: Join the first end point B to A and last end point F to G which completes the frequency polygon.
Frequency polygon can also be drawn independently without drawing histogram. For this, we require the midpoints of the class interval of the data.
ii)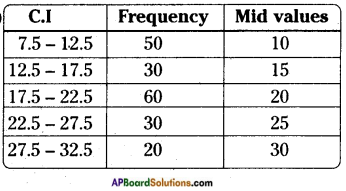
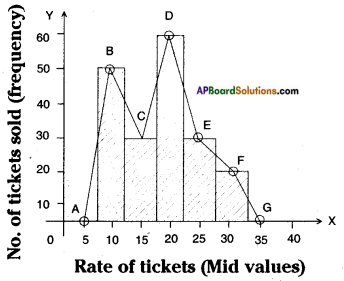
Steps of construction:
Step -1: Calculate the mid points of every class interval given in the data.
Step – 2: Draw a histogram for this data and mark the mid points of the tops of the rectangles (like B, C, D, E, F respectively).
Step – 3: Join the mid points successively.
Step – 4: Assume a class interval before the first class and another after the last class.
Step – 5: To find the class preceding 2.5 – 7.5, we extend the horizontal axis in the negative direction and find the mid point of the imaginary class interval 32.5 – 37.5 like A, G.
Step – 6: Join A to B and G to F.
∴ The required ABCDEFG polygon is formed.
Try these
Question 1.
Give any three examples of data which are in situations or in numbers. [Page No. 148]
Answer:
1) The data of 35 students who like different games: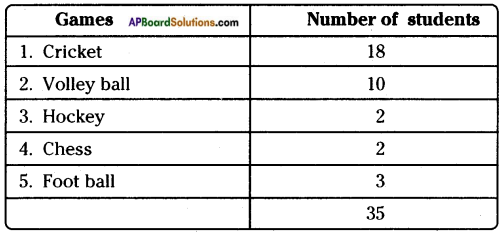
2) The data of 35 students who like different colours: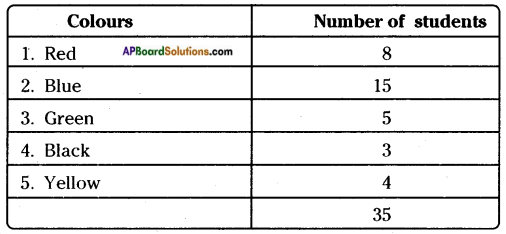
3) The data of 35 students who like different fruits: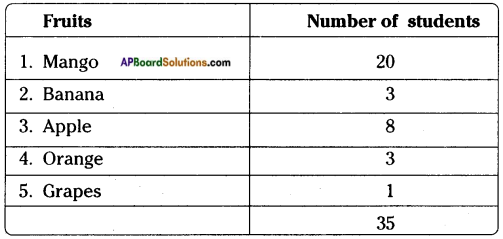
Question 2.
Prepare a table of estimated mean, deviations of the above cases. Observe the average of deviations with the difference of estimated mean and actual mean. What do you infer?
[Hint: Compare with average deviations] [Page No. 151]
Answer: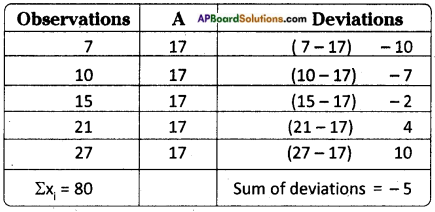
Mean = Σ𝑥𝑖𝑁 = 805 = 16
Mean of the deviations = −55 = -1
Mean = Assumed mean + Mean of deviations = 17 + (-1) = 16
∴ Assumed mean, original arithmetic mean are equal.
Question 3.
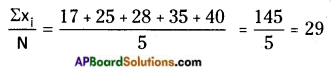
Estimate the arithmetic mean of the following data. [Page No. 153]
i) 17, 25, 28, 35, 40
ii) 5, 6, 7, 8, 8, 10 10, 10, 12, 12, 13, 19, 19, 19, 20
Verify your answers by actual calculations.
Answer:
i) 17, 25, 28, 35, 40
Assumed Mean = 35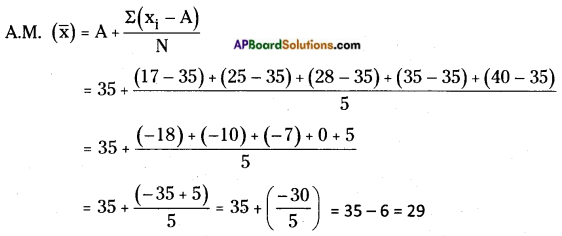
A.M in general method = Sum of the observations No. of the observations
ii) 5, 6, 7, 8, 8, 10, 10, 10, 12, 12, 13, 19, 19, 19, 20
Assumed Mean = 10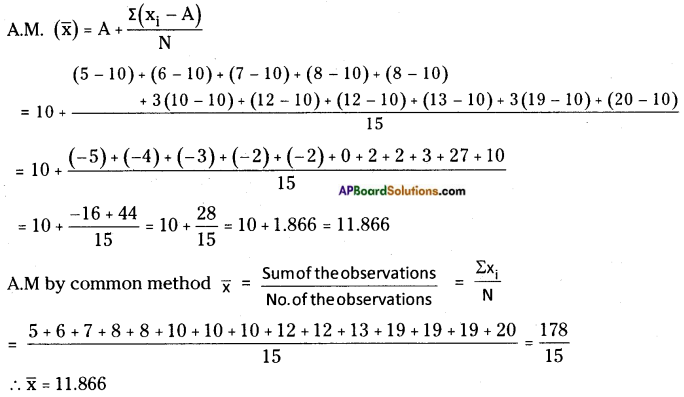
Question 4.
Find the median of the data 24, 65, 85, 12, 45, 35, 15. [Page No. 155]
Answer:
The ascending order of the data is 12, 15, 24, 35, 45, 65, 85
Number of observations (n) = 7 (odd)
∴ Median = 𝑛+12 = 7+12 = 4th term
∴ Median = 35
Question 5.
If flie median of x, 2x, 4x is 12, then find mean of the data. [Page No. 155]
Answer:
Given observations are x, 2x, 4x
∴ Median = 2x
According to the sum
2x = 12 ⇒ x = 6
2x = 2 × 6 = 12
4x = 4 × 6 = 24
∴ The mean of 6, 12, 24 = 6+12+243 = 423 = 14
Question 6.
If the median of the data 24, 29, 34, 38, x is 29 then the value of ‘x’ is
i) x > 38 ii) x < 29 iii) x lies in between 29 and 34 iv) none [Page No. 155]
Answer:
Median of 24, 29, 34, 38, x is 29.
n = 5 is an odd.,
∴ Median = 𝑛+12 = 5+12 = 3rd term
If x is less than 29, then only 29 should be a 3rd term.
∴ x < 29
Question 7.
Less than cumulative frequency is related to ……. [Page No. 165]
Answer:
Upper boundaries
Question 8.
Greater than cumulative frequency is related to …….. [Page No. 165]
Answer:
Lower boundaries
Question 9.
Write the Less than and Greater than cumulative frequencies for the following data. [Page No. 165]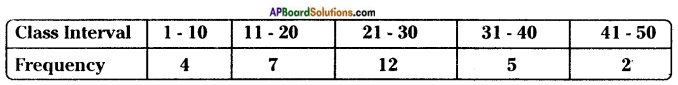
Answer: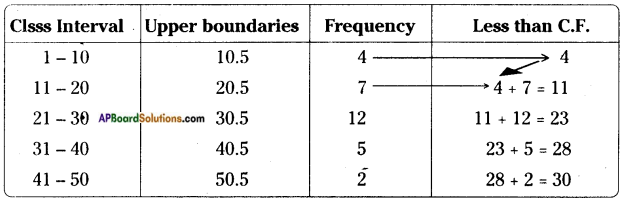
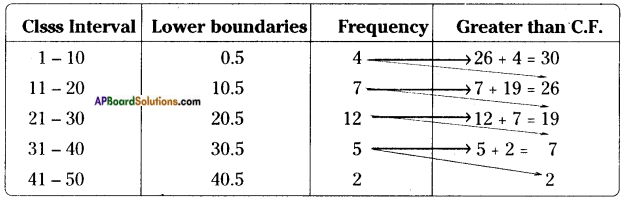
Question 10.
What is total frequency and less than cumulative frequency of the last class above problem? What do you infer? [Page No. 165]
Answer:
The sum of the frequencies in the above distribution table = 30
Less than C.F of the last C.I = 30
∴ Sum of the observations = Less than C.F of last C.I.
Question 11.
Observe the adjacent histogram and answer the following questions. [Page No. 169]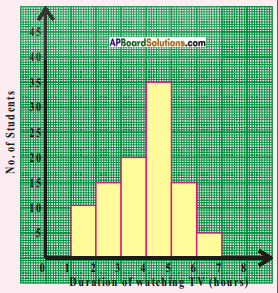
i) What information is being represented in the histogram?
ii) Which group contains maximum number of students?
iii) How many students watch TV for 5 hours or more?
iv) How many students are surveyed in total?
Answer:
i) The histogram represents students who watch the T.V.’s .(Duration of watching T.V).
ii) 4th class interval contains maximum number of students.
iii) 35 + 15 + 5 = 55
iv) Number of students are surveyed = 10 + 15 + 20 + 35 + 15 + 5 = 100
Think, discuss and write
Question 1.
Is there any change in mode, if one or two or more observations, equal to mode are included in the data? [Page No. 155]
Answer:
If one or two or more observations equal to mode are included there will be no change in the mode.
Ex: The mode of 5, 6, 7, 8, 7, 9 is 7.
If 3, 7’s are added to above observations there will be no change in the mode.
Question 2.
Make a frequency distribution of the following series.
1, 2, 2, 3, 3, 3, 3, 3, 4, 4, 4, 4, 4, 4, 4, 4, 4, 5, 5, 5, 5, 5, 5, 5, 6, 6, 6, 6, 7, 7. [Page No. 161]
Answer:
The range of the observations = Highest value – Least value
∴ Range = 7 – 1 = 6
If number of classes = 7 then
Class Interval = Range No. of classes = 67 = 0.8 (approx.)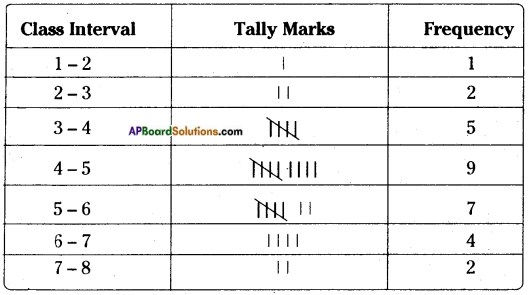
Question 3.
Construct a frequency distribution for the following series of numbers.
2, 3, 4, 6, 7, 8, 9, 9, 11, 12, 12, 13, 13, 13, 14, 14, 14, 15, 16, 17, 18, 18, 19, 20, 20, 21, 22, 24, 24, 25. (Hint: Use inclusive classes) [Page No. 161]
Answer:
Range = Maximum value – Minimum value = 25 – 2 = 23
Class Interval = Range No. of classes = 235 = 4.6 = 5 (approx.) [∵ No. of classes = 5]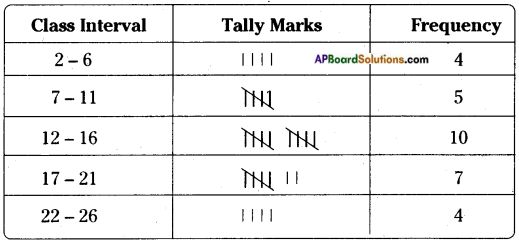
Question 4.
What are the differences between the above two frequency distribution tables? [Page No. 161]
Answer:
The class intervals of first frequency distribution table are exclusive class intervals. The C.I’s of 2nd frequency distribution table are inclusive class intervals.
Question 5.
From which of the frequency distributions we can write the raw data again? [Page No. 161]
Answer:
Classes
Question 6.
All the bars (or rectangles) in a bar graph have [Page No. 168]
a) same length b) same width c) same area d) equal value
Answer:
b) same width
Question 7.
Does the length of each bar depend on the lengths of other bars in the graphs? [Page No. 168]
Answer:
No
Question 8.
Does the variation in the value of a bar affect the values of other bars in the same graph? [Page No. 168]
Answer:
No
Question 9.
Where do we use vertical bar graphs and horizontal bar graphs? [Page No. 168]
Answer:
Vertical and horizontal bar graphs are used to present the equal widths corresponding to the given frequencies.
Question 10.
Class boundaries are taken on the X-axis. Why not class limits? [Page No. 172]
Answer:
The difference between upper and lower boundaries gives the class interval i.e., we take class boundaries on X-axis.
Question 11.
Which value decides the width of each rectangle in the histogram? [Page No. 172]
Answer:
Class Interval
Question 12.
What does the sum of heights of all rectangles represent? [Page No. 172]
Answer:
Sum of the frequencies.
Question 13.
How do we complete the polygon when there is no class preceding the first class? [Page No. 173]
Answer:
The frequency of preceding class should be taken as ‘0’ (zero) then it should be joined.
Question 14.
The area of histogram of a data and its frequency polygon are same. Reason how? [Page No. 173]
Answer:
Because both the figures are constructed on the basis of mid values of class intervals.
Question 15.
Is it necessary to draw histogram for drawing a frequency polygon? [Page No. 173]
Answer:
No need.
Question 16.
Shall we draw a frequency polygon for frequency distribution of discrete series? [Page No. 173]
Answer:
No, we can’t.
Question 17.
Histogram represents frequency over a class interval. Can it represent the frequency at a particular point value? [Page No. 175]
Answer:
Yes, the histogram represents the frequency at a particular point value. Since the length of a histogram represents the value of its corresponding frequency (length of the frequency).
Question 18.
Can a frequency polygon give an idea of frequency of observations at a particular point? [Page No. 175]
Answer:
Yes, we can identify the frequency of observation with a frequency polygon at a particular point. Since the height of the polygon is equal to frequency of polygon
AP Board Textbook Solutions PDF for Class 8th Maths
- AP Board Class 8 Textbook Solutions PDF
- AP Board Class 8 Maths Textbook Solutions PDF
- AP Board Class 8 Maths Chapter 1 Rational Numbers Ex 1.1 Textbook Solutions PDF
- AP Board Class 8 Maths Chapter 1 Rational Numbers Ex 1.2 Textbook Solutions PDF
- AP Board Class 8 Maths Chapter 1 Rational Numbers Ex 1.3 Textbook Solutions PDF
- AP Board Class 8 Maths Chapter 1 Rational Numbers InText Questions Textbook Solutions PDF
- AP Board Class 8 Maths Chapter 2 Linear Equations in One Variable Ex 2.1 Textbook Solutions PDF
- AP Board Class 8 Maths Chapter 2 Linear Equations in One Variable Ex 2.2 Textbook Solutions PDF
- AP Board Class 8 Maths Chapter 2 Linear Equations in One Variable Ex 2.3 Textbook Solutions PDF
- AP Board Class 8 Maths Chapter 2 Linear Equations in One Variable Ex 2.4 Textbook Solutions PDF
- AP Board Class 8 Maths Chapter 2 Linear Equations in One Variable Ex 2.5 Textbook Solutions PDF
- AP Board Class 8 Maths Chapter 2 Linear Equations in One Variable InText Questions Textbook Solutions PDF
- AP Board Class 8 Maths Chapter 3 Construction of Quadrilaterals Ex 3.1 Textbook Solutions PDF
- AP Board Class 8 Maths Chapter 3 Construction of Quadrilaterals Ex 3.2 Textbook Solutions PDF
- AP Board Class 8 Maths Chapter 3 Construction of Quadrilaterals Ex 3.3 Textbook Solutions PDF
- AP Board Class 8 Maths Chapter 3 Construction of Quadrilaterals InText Questions Textbook Solutions PDF
- AP Board Class 8 Maths Chapter 4 Exponents and Powers Ex 4.1 Textbook Solutions PDF
- AP Board Class 8 Maths Chapter 4 Exponents and Powers Ex 4.2 Textbook Solutions PDF
- AP Board Class 8 Maths Chapter 4 Exponents and Powers InText Questions Textbook Solutions PDF
- AP Board Class 8 Maths Chapter 5 Comparing Quantities Using Proportion Ex 5.1 Textbook Solutions PDF
- AP Board Class 8 Maths Chapter 5 Comparing Quantities Using Proportion Ex 5.2 Textbook Solutions PDF
- AP Board Class 8 Maths Chapter 5 Comparing Quantities Using Proportion Ex 5.3 Textbook Solutions PDF
- AP Board Class 8 Maths Chapter 5 Comparing Quantities Using Proportion InText Questions Textbook Solutions PDF
- AP Board Class 8 Maths Chapter 6 Square Roots and Cube Roots Ex 6.1 Textbook Solutions PDF
- AP Board Class 8 Maths Chapter 6 Square Roots and Cube Roots Ex 6.2 Textbook Solutions PDF
- AP Board Class 8 Maths Chapter 6 Square Roots and Cube Roots Ex 6.3 Textbook Solutions PDF
- AP Board Class 8 Maths Chapter 6 Square Roots and Cube Roots Ex 6.4 Textbook Solutions PDF
- AP Board Class 8 Maths Chapter 6 Square Roots and Cube Roots Ex 6.5 Textbook Solutions PDF
- AP Board Class 8 Maths Chapter 6 Square Roots and Cube Roots InText Questions Textbook Solutions PDF
- AP Board Class 8 Maths Chapter 7 Frequency Distribution Tables and Graphs Ex 7.1 Textbook Solutions PDF
- AP Board Class 8 Maths Chapter 7 Frequency Distribution Tables and Graphs Ex 7.2 Textbook Solutions PDF
- AP Board Class 8 Maths Chapter 7 Frequency Distribution Tables and Graphs Ex 7.3 Textbook Solutions PDF
- AP Board Class 8 Maths Chapter 7 Frequency Distribution Tables and Graphs InText Questions Textbook Solutions PDF
- AP Board Class 8 Maths Chapter 8 Exploring Geometrical Figures Ex 8.1 Textbook Solutions PDF
- AP Board Class 8 Maths Chapter 8 Exploring Geometrical Figures Ex 8.2 Textbook Solutions PDF
- AP Board Class 8 Maths Chapter 8 Exploring Geometrical Figures InText Questions Textbook Solutions PDF
- AP Board Class 8 Maths Chapter 9 Area of Plane Figures Ex 9.1 Textbook Solutions PDF
- AP Board Class 8 Maths Chapter 9 Area of Plane Figures Ex 9.2 Textbook Solutions PDF
- AP Board Class 8 Maths Chapter 9 Area of Plane Figures InText Questions Textbook Solutions PDF
- AP Board Class 8 Maths Chapter 10 Direct and Inverse Proportions Ex 10.1 Textbook Solutions PDF
- AP Board Class 8 Maths Chapter 10 Direct and Inverse Proportions Ex 10.2 Textbook Solutions PDF
- AP Board Class 8 Maths Chapter 10 Direct and Inverse Proportions Ex 10.3 Textbook Solutions PDF
- AP Board Class 8 Maths Chapter 10 Direct and Inverse Proportions Ex 10.4 Textbook Solutions PDF
- AP Board Class 8 Maths Chapter 10 Direct and Inverse Proportions InText Questions Textbook Solutions PDF
- AP Board Class 8 Maths Chapter 11 Algebraic Expressions Ex 11.1 Textbook Solutions PDF
- AP Board Class 8 Maths Chapter 11 Algebraic Expressions Ex 11.2 Textbook Solutions PDF
- AP Board Class 8 Maths Chapter 11 Algebraic Expressions Ex 11.3 Textbook Solutions PDF
- AP Board Class 8 Maths Chapter 11 Algebraic Expressions Ex 11.4 Textbook Solutions PDF
- AP Board Class 8 Maths Chapter 11 Algebraic Expressions Ex 11.5 Textbook Solutions PDF
- AP Board Class 8 Maths Chapter 11 Algebraic Expressions InText Questions Textbook Solutions PDF
- AP Board Class 8 Maths Chapter 12 Factorisation Ex 12.1 Textbook Solutions PDF
- AP Board Class 8 Maths Chapter 12 Factorisation Ex 12.2 Textbook Solutions PDF
- AP Board Class 8 Maths Chapter 12 Factorisation Ex 12.3 Textbook Solutions PDF
- AP Board Class 8 Maths Chapter 12 Factorisation Ex 12.4 Textbook Solutions PDF
- AP Board Class 8 Maths Chapter 12 Factorisation InText Questions Textbook Solutions PDF
- AP Board Class 8 Maths Chapter 13 Visualizing 3-D in 2-D Ex 13.1 Textbook Solutions PDF
- AP Board Class 8 Maths Chapter 13 Visualizing 3-D in 2-D Ex 13.2 Textbook Solutions PDF
- AP Board Class 8 Maths Chapter 13 Visualizing 3-D in 2-D InText Questions Textbook Solutions PDF
- AP Board Class 8 Maths Chapter 14 Surface Areas and Volumes Ex 14.1 Textbook Solutions PDF
- AP Board Class 8 Maths Chapter 14 Surface Areas and Volumes Ex 14.2 Textbook Solutions PDF
- AP Board Class 8 Maths Chapter 14 Surface Areas and Volume InText Questions Textbook Solutions PDF
- AP Board Class 8 Maths 8th Class Maths Textbook Telugu Medium Chapter 15 Playing with Numbers Textbook Solutions PDF
- AP Board Class 8 Maths Chapter 15 Playing with Numbers Ex 15.1 Textbook Solutions PDF
- AP Board Class 8 Maths Chapter 15 Playing with Numbers Ex 15.2 Textbook Solutions PDF
- AP Board Class 8 Maths Chapter 15 Playing with Numbers Ex 15.3 Textbook Solutions PDF
- AP Board Class 8 Maths Chapter 15 Playing with Numbers Ex 15.4 Textbook Solutions PDF
- AP Board Class 8 Maths Chapter 15 Playing with Numbers Ex 15.5 Textbook Solutions PDF
- AP Board Class 8 Maths Chapter 15 Playing with Numbers Ex 15.6 Textbook Solutions PDF
- AP Board Class 8 Maths Chapter 15 Playing with Numbers InText Questions Textbook Solutions PDF
- AP Board Class 8 Maths Chapter 1 అకరణీయ సంఖ్యలు Ex 1.1 Textbook Solutions PDF
- AP Board Class 8 Maths Chapter 1 అకరణీయ సంఖ్యలు Ex 1.2 Textbook Solutions PDF
- AP Board Class 8 Maths Chapter 1 అకరణీయ సంఖ్యలు Ex 1.3 Textbook Solutions PDF
- AP Board Class 8 Maths Chapter 1 అకరణీయ సంఖ్యలు InText Questions Textbook Solutions PDF
- AP Board Class 8 Maths Chapter 2 ఏకచరరాశిలో రేఖీయ సమీకరణాలు Ex 2.1 Textbook Solutions PDF
- AP Board Class 8 Maths Chapter 2 ఏకచరరాశిలో రేఖీయ సమీకరణాలు Ex 2.2 Textbook Solutions PDF
- AP Board Class 8 Maths Chapter 2 ఏకచరరాశిలో రేఖీయ సమీకరణాలు Ex 2.3 Textbook Solutions PDF
- AP Board Class 8 Maths Chapter 2 ఏకచరరాశిలో రేఖీయ సమీకరణాలు Ex 2.4 Textbook Solutions PDF
- AP Board Class 8 Maths Chapter 2 ఏకచరరాశిలో రేఖీయ సమీకరణాలు Ex 2.5 Textbook Solutions PDF
- AP Board Class 8 Maths Chapter 2 ఏకచరరాశిలో రేఖీయ సమీకరణాలు InText Questions Textbook Solutions PDF
- AP Board Class 8 Maths Chapter 3 చతుర్భుజాల నిర్మాణాలు Ex 3.1 Textbook Solutions PDF
- AP Board Class 8 Maths Chapter 3 చతుర్భుజాల నిర్మాణాలు Ex 3.2 Textbook Solutions PDF
- AP Board Class 8 Maths Chapter 3 చతుర్భుజాల నిర్మాణాలు Ex 3.3 Textbook Solutions PDF
- AP Board Class 8 Maths Chapter 3 చతుర్భుజాల నిర్మాణాలు Ex 3.4 Textbook Solutions PDF
- AP Board Class 8 Maths Chapter 3 చతుర్భుజాల నిర్మాణాలు Ex 3.5 Textbook Solutions PDF
- AP Board Class 8 Maths Chapter 3 చతుర్భుజాల నిర్మాణాలు Ex 3.6 Textbook Solutions PDF
- AP Board Class 8 Maths Chapter 3 చతుర్భుజాల నిర్మాణాలు InText Questions Textbook Solutions PDF
- AP Board Class 8 Maths Chapter 4 ఘాతాంకాలు మరియు ఘాతాలు Ex 4.1 Textbook Solutions PDF
- AP Board Class 8 Maths Chapter 4 ఘాతాంకాలు మరియు ఘాతాలు Ex 4.2 Textbook Solutions PDF
- AP Board Class 8 Maths Chapter 4 ఘాతాంకాలు మరియు ఘాతాలు InText Questions Textbook Solutions PDF
- AP Board Class 8 Maths Chapter 5 అనుపాతముతో రాశులను పోల్చుట Ex 5.1 Textbook Solutions PDF
- AP Board Class 8 Maths Chapter 5 అనుపాతముతో రాశులను పోల్చుట Ex 5.2 Textbook Solutions PDF
- AP Board Class 8 Maths Chapter 5 అనుపాతముతో రాశులను పోల్చుట Ex 5.3 Textbook Solutions PDF
- AP Board Class 8 Maths Chapter 5 అనుపాతముతో రాశులను పోల్చుట InText Questions Textbook Solutions PDF
- AP Board Class 8 Maths Chapter 6 వర్గమూలాలు, ఘనమూలాలు Ex 6.1 Textbook Solutions PDF
- AP Board Class 8 Maths Chapter 6 వర్గమూలాలు, ఘనమూలాలు Ex 6.2 Textbook Solutions PDF
- AP Board Class 8 Maths Chapter 6 వర్గమూలాలు, ఘనమూలాలు Ex 6.3 Textbook Solutions PDF
- AP Board Class 8 Maths Chapter 6 వర్గమూలాలు, ఘనమూలాలు Ex 6.4 Textbook Solutions PDF
- AP Board Class 8 Maths Chapter 6 వర్గమూలాలు, ఘనమూలాలు Ex 6.5 Textbook Solutions PDF
- AP Board Class 8 Maths Chapter 6 వర్గమూలాలు, ఘనమూలాలు InText Questions Textbook Solutions PDF
- AP Board Class 8 Maths Chapter 7 పౌనఃపున్య విభాజన పట్టికలు, రేఖాచిత్రములు Ex 7.1 Textbook Solutions PDF
- AP Board Class 8 Maths Chapter 7 పౌనఃపున్య విభాజన పట్టికలు, రేఖాచిత్రములు Ex 7.2 Textbook Solutions PDF
- AP Board Class 8 Maths Chapter 7 పౌనఃపున్య విభాజన పట్టికలు, రేఖాచిత్రములు Ex 7.3 Textbook Solutions PDF
- AP Board Class 8 Maths Chapter 7 పౌనఃపున్య విభాజన పట్టికలు, రేఖాచిత్రములు InText Questions Textbook Solutions PDF
- AP Board Class 8 Maths Chapter 8 జ్యామితీయ పటాల అన్వేషణ Ex 8.1 Textbook Solutions PDF
- AP Board Class 8 Maths Chapter 8 జ్యామితీయ పటాల అన్వేషణ Ex 8.2 Textbook Solutions PDF
- AP Board Class 8 Maths Chapter 8 జ్యామితీయ పటాల అన్వేషణ InText Questions Textbook Solutions PDF
- AP Board Class 8 Maths Chapter 9 సమతల పటముల వైశాల్యములు Ex 9.1 Textbook Solutions PDF
- AP Board Class 8 Maths Chapter 9 సమతల పటముల వైశాల్యములు Ex 9.2 Textbook Solutions PDF
- AP Board Class 8 Maths Chapter 9 సమతల పటముల వైశాల్యములు InText Questions Textbook Solutions PDF
- AP Board Class 8 Maths Chapter 10 అనులోమ మరియు విలోమ అనుపాతములు Ex 10.1 Textbook Solutions PDF
- AP Board Class 8 Maths Chapter 10 అనులోమ మరియు విలోమ అనుపాతములు Ex 10.2 Textbook Solutions PDF
- AP Board Class 8 Maths Chapter 10 అనులోమ మరియు విలోమ అనుపాతములు Ex 10.3 Textbook Solutions PDF
- AP Board Class 8 Maths Chapter 10 అనులోమ మరియు విలోమ అనుపాతములు Ex 10.4 Textbook Solutions PDF
- AP Board Class 8 Maths Chapter 10 అనులోమ మరియు విలోమ అనుపాతములు InText Questions Textbook Solutions PDF
- AP Board Class 8 Maths Chapter 11 బీజీయ సమాసాలు Ex 11.1 Textbook Solutions PDF
- AP Board Class 8 Maths Chapter 11 బీజీయ సమాసాలు Ex 11.2 Textbook Solutions PDF
- AP Board Class 8 Maths Chapter 11 బీజీయ సమాసాలు Ex 11.3 Textbook Solutions PDF
- AP Board Class 8 Maths Chapter 11 బీజీయ సమాసాలు Ex 11.4 Textbook Solutions PDF
- AP Board Class 8 Maths Chapter 11 బీజీయ సమాసాలు Ex 11.5 Textbook Solutions PDF
- AP Board Class 8 Maths Chapter 11 బీజీయ సమాసాలు InText Questions Textbook Solutions PDF
- AP Board Class 8 Maths Chapter 12 కారణాంక విభజన Ex 12.1 Textbook Solutions PDF
- AP Board Class 8 Maths Chapter 12 కారణాంక విభజన Ex 12.2 Textbook Solutions PDF
- AP Board Class 8 Maths Chapter 12 కారణాంక విభజన Ex 12.3 Textbook Solutions PDF
- AP Board Class 8 Maths Chapter 12 కారణాంక విభజన Ex 12.4 Textbook Solutions PDF
- AP Board Class 8 Maths Chapter 12 కారణాంక విభజన InText Questions Textbook Solutions PDF
- AP Board Class 8 Maths Chapter 13 త్రిమితీయ వస్తువులను ద్విమితీయంగా చూపుట Ex 13.1 Textbook Solutions PDF
- AP Board Class 8 Maths Chapter 13 త్రిమితీయ వస్తువులను ద్విమితీయంగా చూపుట Ex 13.2 Textbook Solutions PDF
- AP Board Class 8 Maths Chapter 13 త్రిమితీయ వస్తువులను ద్విమితీయంగా చూపుట InText Questions Textbook Solutions PDF
- AP Board Class 8 Maths Chapter 14 ఉపరితల వైశాల్యము మరియు ఘనపరిమాణం (ఘనము-దీర్ఘఘనము) Ex 14.1 Textbook Solutions PDF
- AP Board Class 8 Maths Chapter 14 ఉపరితల వైశాల్యము మరియు ఘనపరిమాణం (ఘనము-దీర్ఘఘనము) Ex 14.2 Textbook Solutions PDF
- AP Board Class 8 Maths Chapter 14 ఉపరితల వైశాల్యము మరియు ఘనపరిమాణం (ఘనము-దీర్ఘఘనము) InText Questions Textbook Solutions PDF
- AP Board Class 8 Maths Chapter 15 సంఖ్యలతో ఆడుకుందాం Ex 15.1 Textbook Solutions PDF
- AP Board Class 8 Maths Chapter 15 సంఖ్యలతో ఆడుకుందాం Ex 15.2 Textbook Solutions PDF
- AP Board Class 8 Maths Chapter 15 సంఖ్యలతో ఆడుకుందాం Ex 15.3 Textbook Solutions PDF
- AP Board Class 8 Maths Chapter 15 సంఖ్యలతో ఆడుకుందాం Ex 15.4 Textbook Solutions PDF
- AP Board Class 8 Maths Chapter 15 సంఖ్యలతో ఆడుకుందాం Ex 15.5 Textbook Solutions PDF
- AP Board Class 8 Maths Chapter 15 సంఖ్యలతో ఆడుకుందాం Ex 15.6 Textbook Solutions PDF
- AP Board Class 8 Maths Chapter 15 సంఖ్యలతో ఆడుకుందాం InText Questions Textbook Solutions PDF


0 Comments:
Post a Comment