 |
| AP Board Class 9 Physical Science Chapter 12 Units and Graphs Textbook Solutions PDF: Download Andhra Pradesh Board STD 9th Physical Science Chapter 12 Units and Graphs Book Answers |
Andhra Pradesh Board Class 9th Physical Science Chapter 12 Units and Graphs Textbooks Solutions PDF
Andhra Pradesh State Board STD 9th Physical Science Chapter 12 Units and Graphs Books Solutions with Answers are prepared and published by the Andhra Pradesh Board Publishers. It is an autonomous organization to advise and assist qualitative improvements in school education. If you are in search of AP Board Class 9th Physical Science Chapter 12 Units and Graphs Books Answers Solutions, then you are in the right place. Here is a complete hub of Andhra Pradesh State Board Class 9th Physical Science Chapter 12 Units and Graphs solutions that are available here for free PDF downloads to help students for their adequate preparation. You can find all the subjects of Andhra Pradesh Board STD 9th Physical Science Chapter 12 Units and Graphs Textbooks. These Andhra Pradesh State Board Class 9th Physical Science Chapter 12 Units and Graphs Textbooks Solutions English PDF will be helpful for effective education, and a maximum number of questions in exams are chosen from Andhra Pradesh Board.Andhra Pradesh State Board Class 9th Physical Science Chapter 12 Units and Graphs Books Solutions
| Board | AP Board |
| Materials | Textbook Solutions/Guide |
| Format | DOC/PDF |
| Class | 9th |
| Subject | Maths |
| Chapters | Physical Science Chapter 12 Units and Graphs |
| Provider | Hsslive |
How to download Andhra Pradesh Board Class 9th Physical Science Chapter 12 Units and Graphs Textbook Solutions Answers PDF Online?
- Visit our website - Hsslive
- Click on the Andhra Pradesh Board Class 9th Physical Science Chapter 12 Units and Graphs Answers.
- Look for your Andhra Pradesh Board STD 9th Physical Science Chapter 12 Units and Graphs Textbooks PDF.
- Now download or read the Andhra Pradesh Board Class 9th Physical Science Chapter 12 Units and Graphs Textbook Solutions for PDF Free.
AP Board Class 9th Physical Science Chapter 12 Units and Graphs Textbooks Solutions with Answer PDF Download
Find below the list of all AP Board Class 9th Physical Science Chapter 12 Units and Graphs Textbook Solutions for PDF’s for you to download and prepare for the upcoming exams:9th Class Physical Science 12th Lesson Units and Graphs Textbook Questions and Answers
Improve Your Learning
9th Class Physical Science 12th Lesson Units and Graphs 1 Mark Questions and Answers
Question 1.
What is Unit?
Answer:
A unit is a standard measure used for comparing measurements.
Question 2.
Why do we use different units for different items?
Answer:
Depending on the quantities of material the units may be expressed.
Question 3.
Write fundamental quantities in MKS system.
Answer:
Mass (m), Length (l) and Time (t).
Question 4.
What are fundamental quantities?
Answer:
Fundamental quantities are those physical quantities that cannot be expressed in terms of other quantities.
Question 5.
What is fundamental unit?
Answer:
Units used to express fundamental quantities are called fundamental units.
Question 6.
Write fundamental units in MKS system.
Answer:
Meter, Kilogram and Second.
Question 7.
What is CGS system?
Centimeter, Grams and Seconds.
Question 8.
What is SI system? When was it introduced?
Answer:
SI system means International System of units. It was introduced in 1971.
Question 9.
List the fundamental quantities that are added to SI system.
Answer:
Electricity, light intensity, quantity of substance, temperature and plane angle.
Question 10.
What is difference between MKS and SI systems?
Answer:
- MKS system has only three fundamental quantities. Those are length, mass and time.
- SI system has eight fundamental quantities. Those are length, mass, time, electricity, light intensity, quantity of substance, temperature, plane angle.
Question 11.
What is derived quantity?
Answer:
The quantities that are obtained by combining fundamental quantities either by multiplication or division or both operations are called derived quantities.
Question 12.
What are derived units?
Answer:
The derived units of measurement derived from the fundamental units.
Question 13.
Write derived units of area and volume.
Derived units of area = m²
Derived units of volume = m³
Question 14.
What are the fundamental units are used to express the units of Force?
Answer: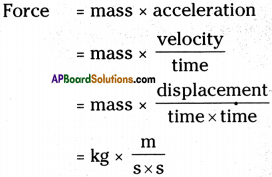
Hence fundamental units used to express force are kg, m, s.
Question 15.
Which conversion factor is used to convert kilometers into meter?
Answer:
1000.
Question 16.
Which conversion factor is used to convert meters into kilometers?
Answer:
10-3.
Question 17.
Write conversion factor to convert km/hr into m/s.
Answer:
\(\frac{5}{18}\)
Question 18.
Write some units of measurements expressed in the name of scientists.
Answer:
Newton (N), Pascal (Pa), Joule (J), Watt (W), etc.
Question 19.
What is graph?
Answer:
A pictorial form of representation that shows the relation between two quantities can be called a graph.
Question 20.
What are independent and dependent variables?
Answer:
Independent variables are controlled by us. Whereas dependent variables are changed due to the change in dependent variable.
Question 21.
Which variable is taken on x – axis?
Answer:
Independent variable.
Question 22.
What are grids on graph paper?
Answer:
On a graph paper, there are thick as well as fine vertical and horizontal lines. These intersecting lines form squares or grids.
Question 23.
What is Range?
Answer:
Range = highest value – lowest value.
Question 24.
What is scaling?
Answer:
Pointing of the values in the table on x – axis and y – axis is called scaling.
Question 25.
What is scale?
Answer:
The interval taken pointing values on axis is called scale.
Question 26.
How do you find x – axis scale?
Answer: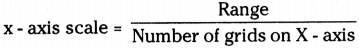
Question 27.
What is curved line graph?
Answer:
If a graph is in curved shape, then it is curved line graph.
Question 28.
What is Hooke’s law?
Answer:
The elongation of the spring is proportional to the applied mass within the elastic limit of the spring.
Question 29.
What is slope of the straight line graph?
Answer:
Question 30.
What is slope of a graph?
Answer:
The tan value of the angle at x – axis is the slope of a graph.
tan θ = \(\frac{\Delta \mathrm{y} }{\Delta \mathrm{x}}\)
Question 31.
What is area of a graph?
Answer:
The product of the physical quantity of y – axis and x – axis may explain another physical quantity. Hence, it is said to be area of the graph.
Question 32.
What does slope indicate to the graph of displacement and time?
Answer:
Velocity.
Question 33.
What does area of the graph of acceleration Vs time indicate?
Answer:
Question 34.
Predict shape of the graph if you plot a graph by taking time on x – axis and velocity of a free fall body on y – axis.
Answer:
Straight line.
Question 35.
Guess the shape of the graph if you plot a graph of time and distance covered by a bus.
Answer:
Curved graph.
Question 36.
Rithvik wrote ‘3 kgs of sugar’ on the black board. Correct him by asking a question.
Answer:
Is it correct to mention kg in plural form while writing units?
Question 37.
Karthik got a doubt by seeing ‘3 newtons’ on the black board. What would be it?
Answer:
Which quantity is measured in newtons ?
Question 38.
What are the materials / apparatus required to prove Hooke’s law?
Answer:
- Spring,
- Weights,
- Scale,
- Stand.
Question 39.
Area, volume, density, mass
a) Write any one fundamental quantity from the above data.
b) Write any one derived quantity from the above data.
Answer:
a) mass.
b) volume.
Question 40.
‘Dheeraj counted distance travelled by him for every 10 min.’
From the above data write independent and dependent variables.
Answer:
Time (min) is independent variable distance is dependent variable.
Question 41.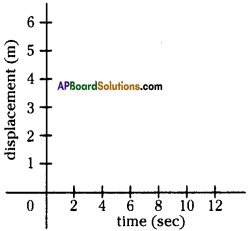
Plot the data points (6, 4) and (0, 0) in the above graph.
Answer: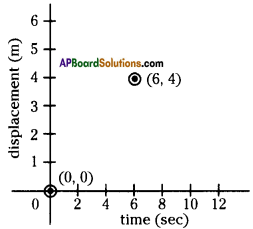
Question 42.
How do you remember scientists through units of measurements?
Answer:
Some units are expressed in the names of the scientists like newton, joule, etc. When we use these units, scientists are remember once again.
Question 43.
What is the use of graph?
Answer:
- We can solve so many problems by using graphs.
- We can know the relation between two physical quantities through graphs.
Question 44.
Calculate the Range of 5, 7, 3, 8, 18, 4, 2, 6.
Answer:
Range = highest value – lowest value
= 18-2 = 16.
Question 45.
If the range is 10 and no. of grids horizontally is 20. How can you take scale X-axis?
Answer: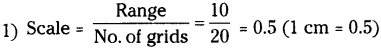
2) I will take 0.5,1,1.5, 2, 2.5,3,3.5, 4, 4.5, 10 on the X-axis. As a scale on x-axis.
Question 46.
How slope of displacement Vs time graph is useful?
Answer:
We can calculate velocity by calculating slope of line in displacement Vs time graph.
Question 47.
How area of velocity Vs time graph is useful?
Answer:
Area of velocity Vs time graph is useful to find the position of the object.
Question 48.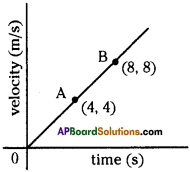
What is the acceleration at ‘B’?
Answer: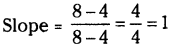
Acceleration is 1 m/s².
Question 49.
Find the acceleration at ‘A’.
Answer: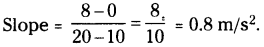
Question 50.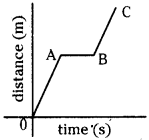
How much distance is travelled by the object from A to B in the graph?
Answer:
Zero.
9th Class Physical Science 12th Lesson Units and Graphs 2 Marks Questions and Answers
Question 1.
What is a unit? Where it be placed?
Answer:
- A unit is a standard measure used for comparing measurements.
- Unit should be placed right side of the magnitude of every physical quantity. For eg : 2 kg, 7 m.
Question 2.
Differentiate fundamental quantities and derived quantities.
Answer:
| Fundamental quantity | Derived quantity |
| 1) Fundamental quantities are those physical quantities that cannot be expressed in terms of other quantities. | 1) The quantities that are obtained by combining fundamental quantities either by multiplication or division or both are called derived quantities. |
| 2) These are independent. | 2) These are dependent. |
| 3) Eg : Mass, length, time. | 3) Eg : Area, density, force. |
Question 3.
Derive units of density.
Answer: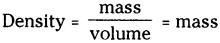
Question 4.
Write different system of measurements.
Answer:
- FPS : Foot, Pound, Second.
- CGS : Centimeter, Gram, Second.
- MKS : Meter, Kilogram, Second.
- SI : Meter, Kilogram, Second, Ampere, Candela, Mole, Kelvin, Radian.
Question 5.
Derive units to the given physical quantities.
Answer: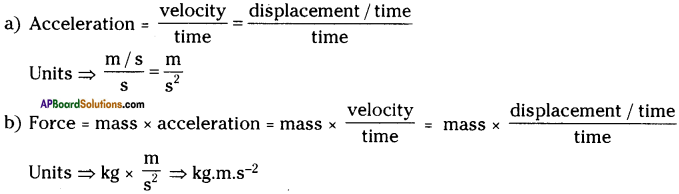
Question 6.
Which of the following are correct? Why?
Answer:
A) m/s
B) m/s/s
C) m-s²
D) 10.kgs
E) Pascal
F) joule
Answer:
A) and F) only are correct
B) two solidus are used – wrong.
C) line break is used – wrong.
D) ‘•’ and plural of kg are used – wrong.
E) capital letter used (P) – wrong.
Question 7.
Write correct form of units in the following.
(j) DB
(ii) mhz
(iii) 20 – m
(iv) kg.m-s-2
Answer:
(i) dB
(ii) MHz
(iii) 20 m
(iv) Kg.m.s-2
Question 8.
How do you expect the shape of the given graphs?
(a) a ∝ b
(b) a ∝ \(\frac{1}{\mathbf{b}}\)
Answer:
a) It may be straight line graph.
b) It may be curved line graph.
Question 9.
From the graph,
a) What is indicated by slopes of the lines OA, OB, OC?
b) Which line shows high speed than other lines? Why?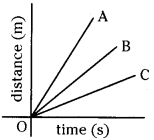
Answer:
a) Slopes of the lines indicate speeds of the objects.
b) OA shows high speed than other lines.
Because it has high slope than others.
Question 10.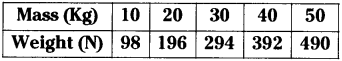
a) Which is independent variable?
b) Which is dependent variable?
c) Predict how the graph is.
d) Find the range on Y – axis.
Answer:
a) Mass
b) Weight
c) It may be in straight line.
d) On Y – axis, values are 98, 196, 294, 392, 490.
Range = 490 – 98 = 392
Question 11.
Plot the given data points on the given graph paper and join the dots.
Data points : (8, 10) (20, 15) (40, 22.5) (48, 0)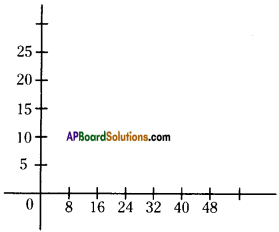
Answer: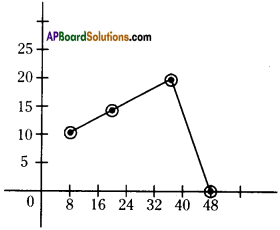
Question 12.
Draw a graph roughly to show uniform velocity of a body.
Answer: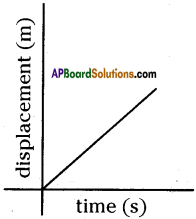
Question 13.
Draw a graph that shows a body without movement after travelling sometime.
Answer: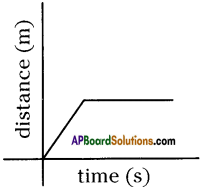
Question 14.
How do you appreciate the role of graphs in solving problems?
Answer:
- Graphs can be used to compare different physical quantities like time- displacement, time-velocity, pressure-volume, etc. and helps in solve the problems.
- Graphs are very useful to find the path of an object which is in motion and it is easy to calculate velocity, acceleration, position, etc. at particular time and particular point of the object.
- Graphs are very useful minimum, maximum values of some physical quantities. For example to find minimum deviation of a prism graphs are very useful.
- In this way graphs are appreciable for their role in solving problems.
Question 15.
From the given graph find the slope and area at point B.
Answer: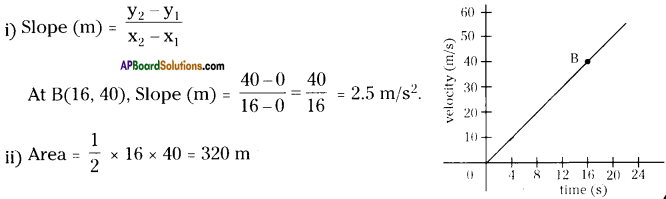
Question 16.
Convert 3 m/s into km/hr.
Answer: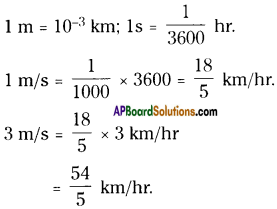
Question 17.
A ball of 100 g mass is thrown with initial velocity of 0.01 km/s. What is its momentum at that time?
Answer:
Momentum = mass × velocity
Here, mass of the ball = 100 gr = 100 × \(\frac{1}{100}\) kg ⇒ m = 0.1 kg
Velocity of the ball = 0.01 km/s = 0.01 × 1000 m/s ⇒ v = 10 m/s
Momentum of the ball = mxv = 0.1 × 10 kg.m/s = 1 kg.m/s
Question 18.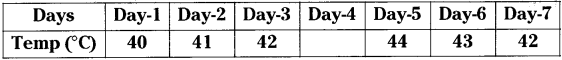
Find the temperature on Day – 4 by using graph.
Answer: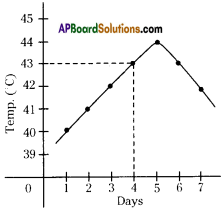
From the graph the temperature on day – 4 is 43°C.
Question 19.
Observe table and answer the following.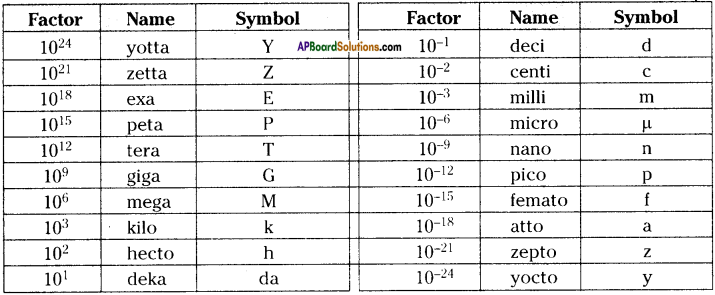
i) 12 cm = …………. m
ii) 2 nm = …………. cm
Answer:
i) 12 cm = 12 × 10-2 m
ii) 2 nm = 2 × 10⁻⁷ cm
[From the table 1 nanometer = 10-9 m; 1 centimeter = 10-2 m.
1 nanometer to centimeter conversion factor = 10-9-(-2) = 10-7.]
Question 20.
Find the conversion factors
a) Picometers to Meters
b) Gigabytes to Kilobytes.
Answwr:
From the above table,
a) 1 picometer = 10-12 m; 1 meter = 10° m
Conversion factor to convert picometers to meters = 10-12-(-0) = 10-12 m
b) 1 GB = 109 bytes ; 1 KB = 10³ bytes
Conversion factor to convert GB to KB = 109-3 = 106 bytes.
Question 21.
Find the conversion factors
a) Megawatts to Kilowatts
b) Kilowatts to Megawatts.
Answer:
From the above table,
a) 1 Megawatt = 106 watts; 1 Kilowatt = 10³ watts
Conversion factor MW to KW = 106-3 = 10³ W
b) 1 KW = 10³ W and 1 MW = 106 W
Conversion factor KW to MW = 103-6 = 10-3 W
9th Class Physical Science 12th Lesson Units and Graphs 4 Marks Questions and Answers
Question 1.
Write any four rules of writing units of measurements.
Answer:
1) Values are written as a number followed by a space and a unit symbol.
eg : 24 kg, 2 cm, 5 s.
2) Symbols for derived units formed by multiplication are joined with a dot or a space.
eg : 30 N.m, 30 N.m
3) Symbols are mathematical entities, not abbreviations. So, do not have an appended period / full stop.
eg : 4 kg is correct, but 4 k.g. is incorrect.
4) All symbols for units are written in lowercase.
eg : m, s, kg, etc.
5) Symbols derived from the name of a person use uppercase letter for shortform.
eg : Pa, N, W, etc.
Question 2.
Write steps in the construction of a graph, to the given data in a tabular form.
Answer:
- Take a graph paper. Draw x – axis and y – axis on it.
- Identify independent variable and dependent variable from the data given in the table. Generally independent variables are decided by us, whereas dependent variables are changed due to the change in independent variable. Take independent variable on x – axis and dependent variable on y – axis.
- Calculate range for values taken on x – axis as well as y – axis, by using the formula. Range = highest value – lowest value.
- Determine the scale to be taken on x – axis and y-axis by calculating, range/no. of grids on axis. And mark the scale on the axes.
- Write names of the physical quantity which is taken on the axis. For eg : time (s), distance (m).
- Write the data points from the data given in the table such as (x1 y1) (x2 y2)
- Label the data points in the graph paper by put a dot where the corresponding horizontal and vertical line intersects of a data point.
- Joint the dots in the graph paper.
Question 3.
Fill the given table with suitable answers.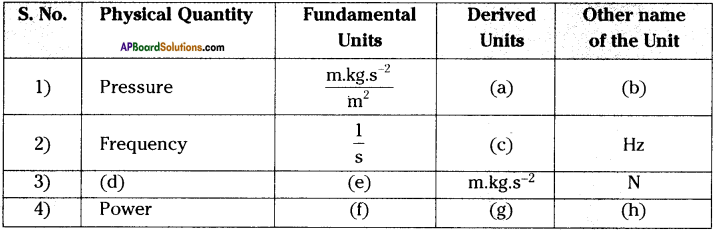
Answer:
a) N/m²
b) Pa [pascal]
c) s-1
d) Force
e) m.kg.s-2
f) m² . kg . s-2
g) J/s (or) \(\frac{N.m}{s}\)
h) W [watt]
Question 4.
Fill the table with suitable answers.
| Derived quantity | Relation with base and derived quantities | Unit |
| Area | | |
| Volume | ||
| Density | ||
| Speed | ||
| Velocity | ||
| Acceleration | ||
| Work | ||
| Momentum |
Answer:
| Derived quantity | Relation with base and derived quantities | Unit |
| Area | length × breadth | m2 |
| Volume | length × width × height | m3 |
| Density | mass / volume | kg m-3 |
| Speed | distance / time | m s-1 |
| Velocity | displacement / time | m s-1 |
| Acceleration | change in velocity / time | m s-2 |
| Work | force × distance | kg m2 s-2 |
| Momentum | mass × velocity | kg.m.s-1 |
Question 5.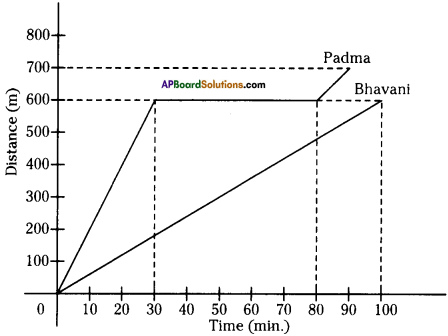
1) Who took rest while travelling?
2) After 100 min., what is the positions of Padma and Bhavani?
3) Whose speed is uniform?
4) What is the speed of Bhavani?
Answer:
- Padma
- Padma at 700 meters and Bhavani at 600 meters from the beginning point.
- Speed of Bhavani is uniform.
- \(\frac{600}{100}\)m/min. = 6 m/min.
Question 6.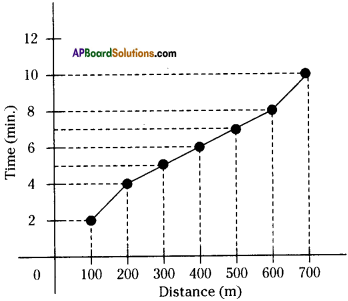
a) Which physical quantity is taken as independent variable?
b) What is the scale on x – axis?
c) What is the scale on y – axis?
d) How the graph is?
Answer:
a) Distance
b) 1 cm = 100 m
c) 1 cm = 2 min.
d) It is a curved line graph.
Question 7.
Draw a graph to the given data.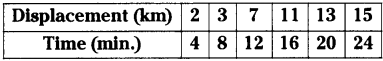
Answer:
1) Draw x – axis and y – axis on a graph paper.
2) Here time is independent variable and displacement is dependent variable. So, take time on x – axis and displacement on y – axis.
3) Calculate the ranges of values on x – axis and y – axis.
Range on x – axis = 24 – 4 = 20
Range on y – axis = 15-2 = 13
4) Estimate scale on x – axis and y – axis.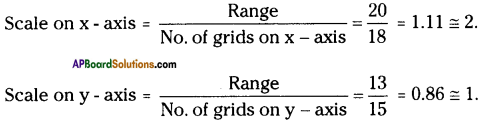
So, scale on x – axis 1 cm = 2 min.
Scale on y – axis 1 cm = 1 km.
Mark the scales on x and y – axis.
5) Write time (min) at x – axis and displacement (km) at y – axis.
6) Write data points or data values as (4, 2) (8, 3) (12, 7) (16, 11) (20, 13) (24, 15).
7) Plot the above data points in the graph paper with dots.
8) Join the data points.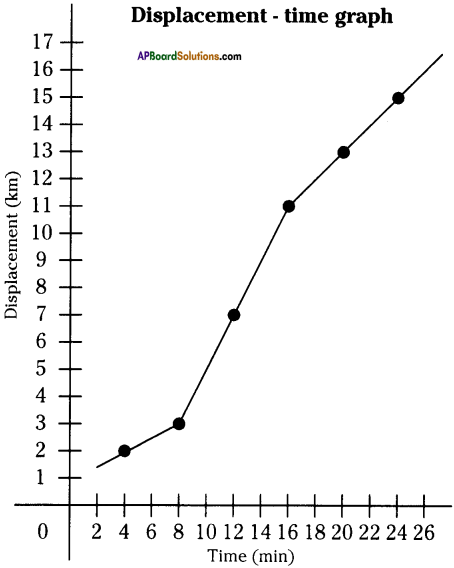
Question 8.
Draw velocity – time graph to the given table.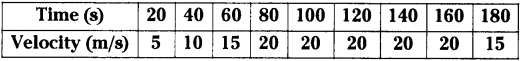
Answer:
1) Draw x – axis and y – axis on a graph paper.
2) Here time is independent variable and velocity is dependent variable. So, take time on x – axis and velocity on y – axis.
3) Calculate the ranges of values on x – axis and y – axis.
Range on x – axis = 180 – 20 = 160
Range on y – axis = 20 – 5 = 15
4) Estimate scale on x – axis and y – axis.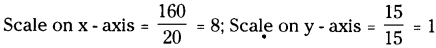
Take scale as 1 cm = 8 s on x – axis.
1 cm = 1 m/s on y – axis.
5) Write time (s) at x – axis, velocity (m/s) on y – axis.
6) Write data points as (20, 5), (40, 10), (60, 15) (80, 20) (100, 20), (120, 20) (140, 20) (160, 20) (180, 15).
7) Plot the data points in the graph paper with dots.
8) Join the dots.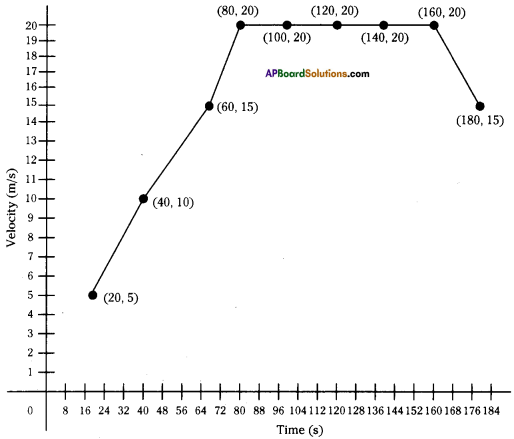
Question 9.
Show that i) v = u + at, ii) s = ut + ½ at² in graphical method.
Answer: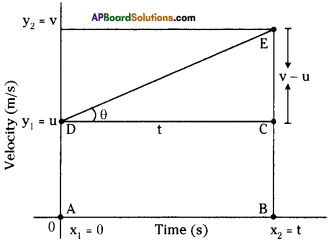
1) Graph is plotted with time on x – axis and velocity on y – axis.
2) According to the above graph,
Velocity of the object at “t” value ”0″ = u
Velocity of the object at “t” value “t” = v
3) Difference between the time intervals = v – u
4) From the graph, x1 = 0, x2 = t, y1 = u, y2 = v
5) We know that slope refers acceleration to the velocity – time graph.
Hence acceleration (a) = \(\frac{\mathrm{v}-\mathrm{u}}{\mathrm{t}}\) ⇒ v – u = at ⇒ v = u + at ………… (1)
6) The area between the two straight lines drawn at u, v gives displacement of the object. The area of graph is in the shape of trapezium. It has a rectangle and a triangle.
7) Area of the graph = area of rectangle (ABCD) + area of triangle (DCE)
8) We know that area of the graph of velocity – time gives displacement(s).
Question 10.
Observe the following graph and calculate displacement of the object in 12 sec.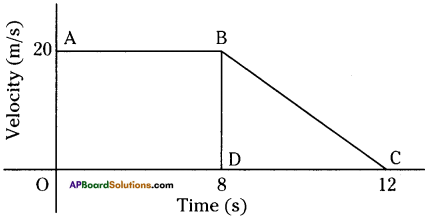
Answer:
1) Displacement (s) = Area of the graph = Area of ABDO rectangle + BDC triangle.
2) Area of the rectangle ABDO = 8 × 20 = 160.
3) Area of the triangle BDC = ½ × 20 × (12 – 8)
= ½ × 20 × 4 = 40.
4) Displacement (s) = 160 + 40 = 200 m.
5) Hence, displacement of the object in 12 sec. = 200 m.
Question 11.
Find the velocity from the graph at A.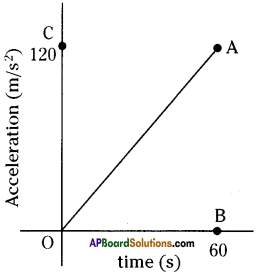
Answer:
- We know that area of the graph of acceleration – time gives velocity (v).
- Join the line AB.
- Velocity (v) = Area of ΔABO = ½ × 60 × 120 = 3600 m/s.
Question 12.
Find the force at point ‘B’.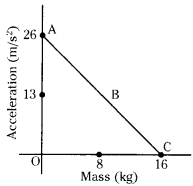
Answer: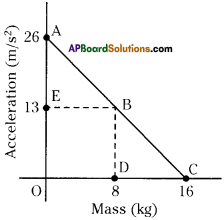
We know that
Force= Area of trapezium ABDO.
= Area of triangle AEB + Area of rectangle EODB
Question 13.
Using the following data. Draw displacement time graph.
Using above graph, what is the average velocity in First “4” Seconds
Answer:
Average velocity in first “4” seconds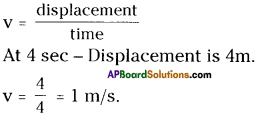
9th Class Physical Science 12th Lesson Units and Graphs InText Questions and Answers
9th Class Physical Science Textbook Page No. 205
Question 1.
Which is bigger, 2 kg or 100 gr?
Answer:
2 kg.
Question 2.
What would be Rasheeda’s answer?
Answer:
2 kg.
Question 3.
If Rasheeda asked the shop keeper to give 2 sugar, 100 tea powder, can he be able to weigh the items? Why?
Answer:
No, the shop keeper cannot weigh. Because there is no measuring terms (units) to weigh.
Question 4.
Can you name the units of time? What are they?
Answer:
Second, minutes, hours, etc.
Question 5.
Why are they (different units to measure a physical quantity) required?
Answer:
Depending upon the quantity, different units to measure are required.
Question 6.
Can we express the mass of chalk in kilogram?
Answer:
It is difficult to measure directly in kilograms.
9th Class Physical Science Textbook Page No. 206
Question 7.
Why do we use different units for different items?
Answer:
Depending on the quantities of material the units may be expressed.
Question 8.
Why are these called fundamental quantities?
Answer:
These (length, mass, time, etc.) are independent quantities, cannot be expressed in terms of other quantities.
Question 9.
What fundamental quantities are there in the table?
Answer:
Length, mass, time electricity, light intensity, quantity of substance, temperature, plane angle.
Question 10.
What similarities have you noticed in MKS and SI systems?
Answer:
Length, mass, time are common in MKS and SI systems.
Question 11.
How do you find the area of the book?
Answer:
By multiplying length and breadth of the book.
Question 12.
What measurements are required to express area?
Answer:
Length and breadth.
9th Class Physical Science Textbook Page No. 208
Question 13.
How can you convert kilometers into meters?
Answer:
We can convert kilometers into meters by multiplying meters with conversion factor 1000.
9th Class Physical Science Textbook Page No. 211
Question 14.
What is the length of each side (of square grid)?
Answer:
1 cm.
Question 15.
What is the distance between the adjacent thin lines?
Answer:
1 mm.
Question 16.
Which axis is time plotted on and which axis represents distance?
Answer:
Time is plotted on x – axis, y – axis represents distance.
Question 17.
How are these (numbers on x – axis) interpreted?
Answer:
By calculating range of the values of data on x – axis.
Question 18.
What is the difference between the highest and the lowest values?
Answer:
40-5 = 35.
9th Class Physical Science Textbook Page No. 212
Question 19.
What is the advantage of knowing the range of values?
Answer:
If the graph is plotted with the help of calculated values of range, the graph is uniformly distributed through the graph paper and has a correct shape. Otherwise, it will be either too big or too small and will not be any help for analysis.
Question 20.
How to identify values on x-axis and y-axis?
Answer:
By determine the scale.
Question 21.
How to determine scale?
Answer: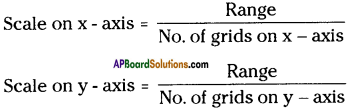
Question 22.
Which values of distance in the table are equal to the values marked on y-axis?
Answer:
3, 12, 24, 24, 30, 33.
9th Class Physical Science Textbook Page No. 213
Question 23.
What is the shape of the line in the graph?
Answer:
It is curved line.
Question 24.
Did you notice any elongation of the spring?
Answer:
Yes, I noticed elongation of the spring.
Question 25.
How much was the elongation?
Answer:
Some extend. It can be calculated by difference in the lengths of the spring.
9th Class Physical Science Textbook Page No. 214
Question 26.
Can you identify the independent and the dependent variables?
Answer:
Mass is independent variable and elongation of the spring is dependent variable.
9th Class Physical Science Textbook Page No. 215
Question 27.
At what point plunger cannot move forward.
Answer:
It is depending upon conditions of the experiment.
Question 28.
Do you experience any pressure with air?
Answer:
Yes.
9th Class Physical Science Textbook Page No. 217
Question 29.
Let us say what is the slope of x – axis?
Answer:
Slope of the x – axis is zero.
9th Class Physical Science Textbook Page No. 218
Question 30.
What does the ratio explains the physical quantities on the y – axis and x – axis?
Answer: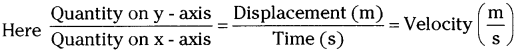
The ratio explains the physical quantities on the y – axis and x – axis is velocity.
Question 31.
What is the velocity of the object at 1.5 seconds of time?
Answer: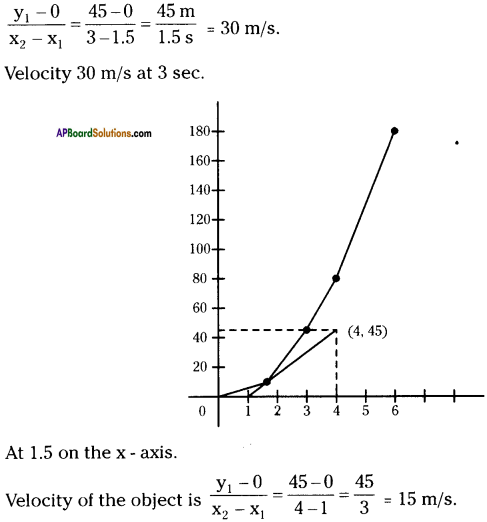
9th Class Physical Science Textbook Page No. 207
Question 32.
Is litre a fundamental unit or a derived unit?
Answer:
One litre is the volume of a cube with 10 cm sides. (10 cm × 10 cm × 10 cm)
(or) 1 L = 10-3 m³
Hence, litre is a derived unit.
9th Class Physical Science 12th Lesson Units and Graphs Activities
Activity – 1
Question 1.
You have noticed that different units are used to measure different materials. Based on your past experience fill in the table with suitable units of measurements used in general, put a tick mark.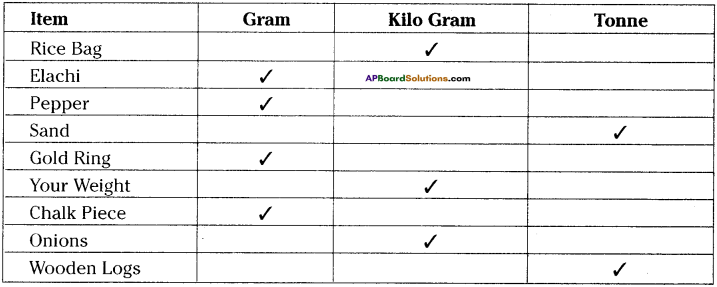
Activity – 2 Derived Quantities – Derived Units
Question 2.
1) Let us measure the surface area of your book using a scale.
2) Measure the length and breadth of the book.
3) Area of the book can be obtained by multiplying length and breadth.
4) Length = ……………………..
5) Breadth = ……………………
Is area of fundamental quantity?
Answer:
No.
Which fundamental quantity is used to derive area?
Answer:
Length.
From the activity, we can say area is a derived quantity, which is obtained by multiplication of length and breadth which are fundamental quantities.
Activity 3
Question 3.
Let us observe the given table and try to find out fundamental and derived units for the given information.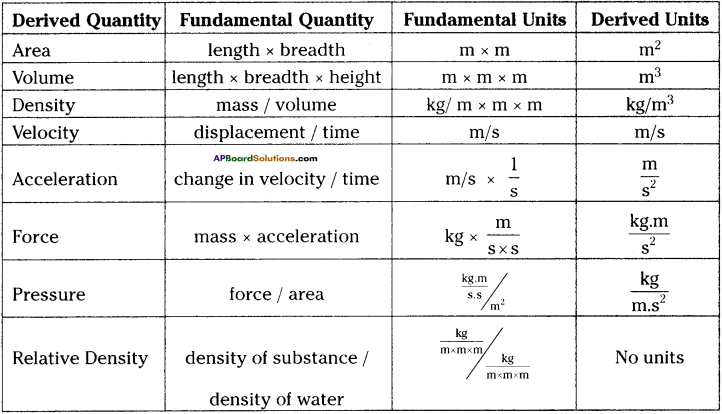
1) Which derived units are obtained by the multiplication of fundamental units?
Answer:
Area, volume
2) Which units are derived from only the fundamental quantity length?
Answer:
Area, volume
3) Which derived quantity has no units?
Answer:
Relative density
4) What are the fundamental units of volume?
Answer:
Length
5) What quantities are derived from time?
Answer:
- Velocity
- Acceleration
- Force
- Pressure
Activity – 4
Question 4.
Draw a curved line graph to the given table.
Answer:
1) Anitha travels to her grandmother’s village by car.
2) She observed the Odometer (the instrument that measures the distance travelled) fitted in the car.
3) She recorded the reading shown by the odometer once every 5 minutes for 40 minutes.
4) Look at the table prepared by Anitha.
5) ‘We show the relation between two quantities using a graph.
6) Here time is independent variable and distance is dependent variable.
7) The steps in the construction of a graph
i) Draw x – axis and y – axis on a graph paper.
Plot time on x – axis as it is independent variable whereas distance on y – axis as it is dependent variable.
ii) Find the range on x – axis
Range on x – axis = highest value – lowest value = 40 – 5 = 35 Find the range on y – axis
Range on y – axis = highest value – lowest value = 33 – 3 = 30
iii) Determine the scale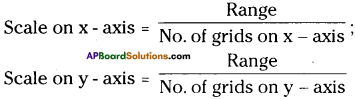
iv) Names on the axis
Write time (min.) on x – axis.
Write distance (km) on y – axis.
v) Write the data points from the table.
(0, 0), (5, 3), (10, 8), (15, 12), (20, 19), (25, 24), (30, 24), (35, 30), (40, 33).
vi) Labelling of data points :
Label above data points with dots where vertical and horizontal lines are intersect to the respective data points.
vii) Join the dots.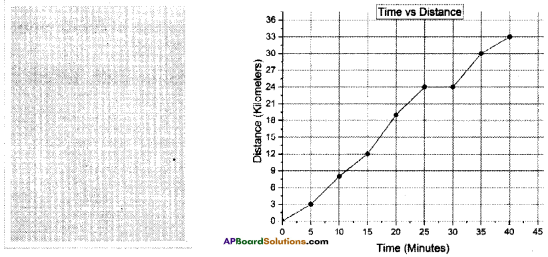
What is the shape of the line graph?
Answer:
It is curved in shape.
Activity 5
Question 5.
Draw a straight line graph to the given table.
Answer:
- Take a spring / rubber band.
- Measure the length of the spring with a scale.
- Fix the spring to the stand.
- Suspend the weight to the second end of the spring.
- Now, again measure the length of the spring.
- Calculate the elongation.
- This way, keep on changing the weights and measure the elongation of the spring with scale.
Record the readings in the table.
9) Here mass (gm) is independent variable and elongation is dependent variable.
10) Plot the graph.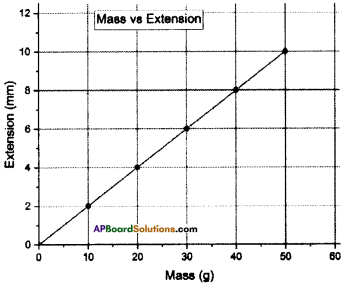
1. Which quantity is taken on the x-axis ? In what units it was expressed? Why was it taken on the x-axis?
Answer:
- Mass is taken on the x – axis.
- It was expressed in grams.
- Mass is independent variable, so it was taken on the x – axis.
2. Which quantity is taken on the y-axis? In what units it was expressed? Can this be called an independent variable?
Answer:
- Elongation of the spring was taken on the y – axis.
- It was expressed in millimeters.
- It cannot be called as independent variable, because the values of elongation are obtained in the experiment.
3. The value of range on the x – axis
Answer:
Range = 50 – 0 = 50
4. The value of range on the y-axis
Answer:
Rang = 10 – 0 = 10
5. Scale on the x-axis
Answer:
10
6. Scale on the y-axis
Answer:
2
7. Data values on the x-axis
Answer:
0, 10, 20, 30, 40, 50.
8. Data values on the y-axis
Answer:
0, 2, 4, 6, 8, 10.
9. What is the shape of the line that joined the intersecting points?
Answer:
Straight line.
10. What does the slope of a curve tell us?
Answer:
Relation between mass and extension of the spring.
11. What is the reason for the elongation of the spring?
Answer:
Due to mass suspension to the spring.
12. What relation did you notice between the mass and elongation of spring?
Answer:
Elongation is directly proportional to mass.
13. Wliat could be the relation between the two quantities when the graph is a straight line?
Answer:
It could be directly proportional.
14. Based on the graph, which of the following sentences are correct?
a) If mass increases the elongation of spring increases.
b) If mass decreases the elongation of spring increases.
c) Even if mass increases, there will be no change in the elongation of the spring.
Answer:
a), b) are correct.
Activity – 6
Question 6.
Plot a graph showing inversely proportional measurements.
Answer:
- Take a 50 ml syringe.
- Fill the syringe with air by pulling a plunger.
- To avoid escape of air from syringe close the nozzle of syringe with your finger.
- Now push (apply the force) the plunger slowly.
- While you are pushing the plunger you may experience more pressure with the decrease of volume of air in syringe, hence you need to apply more force on plunger.
- Let us find out the relation between the pressure and volume of air.
- Observe the following data table.

Physical Quantity on x – axis
Answer:
Pressure
Physical Quantity on y – axis
Answer:
Volume
What is the independent variable?
Answer:
Pressure
What is the dependent variable?
Answer:
Volume
What is the range of values on vertical axis?
Answer:
Range = 50 – 18.7 = 31.3
What is range of values on horizontal axis?
Answer:
Range = 3.2 – 1.2 = 2
What is the shape of the graph?
Answer:
Curved in shape (Parabolic).
What relation you noticed between two physical quantities based on data points in the graph?
Answer:
I have noticed that there is decrease in volume with increase of pressure. Hence these two quantities said to be inversely proportional.
Activity – 7
Question 7.
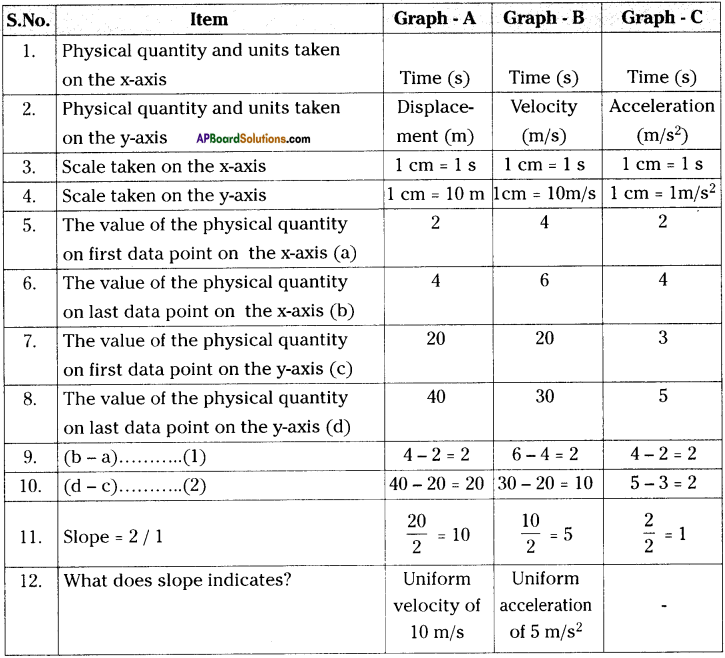
Observe the following graphs and write your analysis in the given table.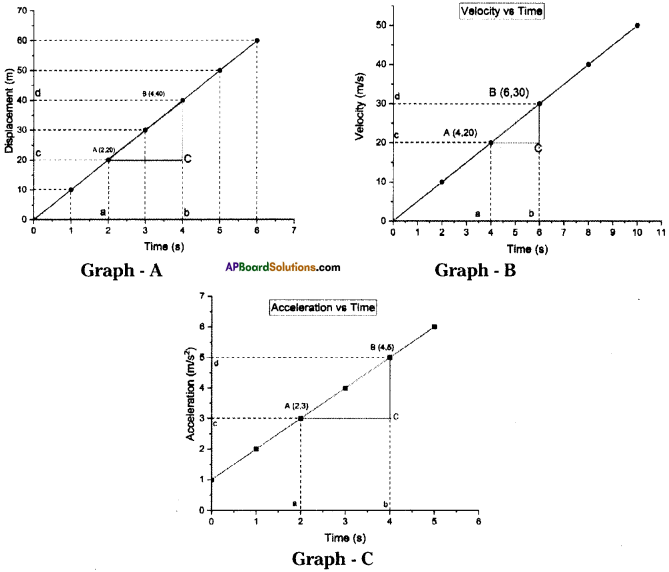
AP Board Textbook Solutions PDF for Class 9th Physical Science
- AP Board Class 9 Textbook Solutions PDF
- AP Board Class 9 Physical Science Textbook Solutions PDF
- AP Board Class 9 Physical Science Chapter 1 Motion Textbook Solutions PDF
- AP Board Class 9 Physical Science Chapter 2 Laws of Motion Textbook Solutions PDF
- AP Board Class 9 Physical Science Chapter 3 Is Matter Pure Textbook Solutions PDF
- AP Board Class 9 Physical Science Chapter 4 Atoms and Molecules Textbook Solutions PDF
- AP Board Class 9 Physical Science Chapter 5 What is inside the Atom Textbook Solutions PDF
- AP Board Class 9 Physical Science Chapter 6 Chemical Reactions and Equations Textbook Solutions PDF
- AP Board Class 9 Physical Science Chapter 7 Reflection of Light at Curved Surfaces Textbook Solutions PDF
- AP Board Class 9 Physical Science Chapter 8 Gravitation Textbook Solutions PDF
- AP Board Class 9 Physical Science Chapter 9 Floating Bodies Textbook Solutions PDF
- AP Board Class 9 Physical Science Chapter 10 Work and Energy Textbook Solutions PDF
- AP Board Class 9 Physical Science Chapter 11 Sound Textbook Solutions PDF
- AP Board Class 9 Physical Science Chapter 12 Units and Graphs Textbook Solutions PDF


0 Comments:
Post a Comment